
What Is Interval Data? A Guide for Commercial Building Owners
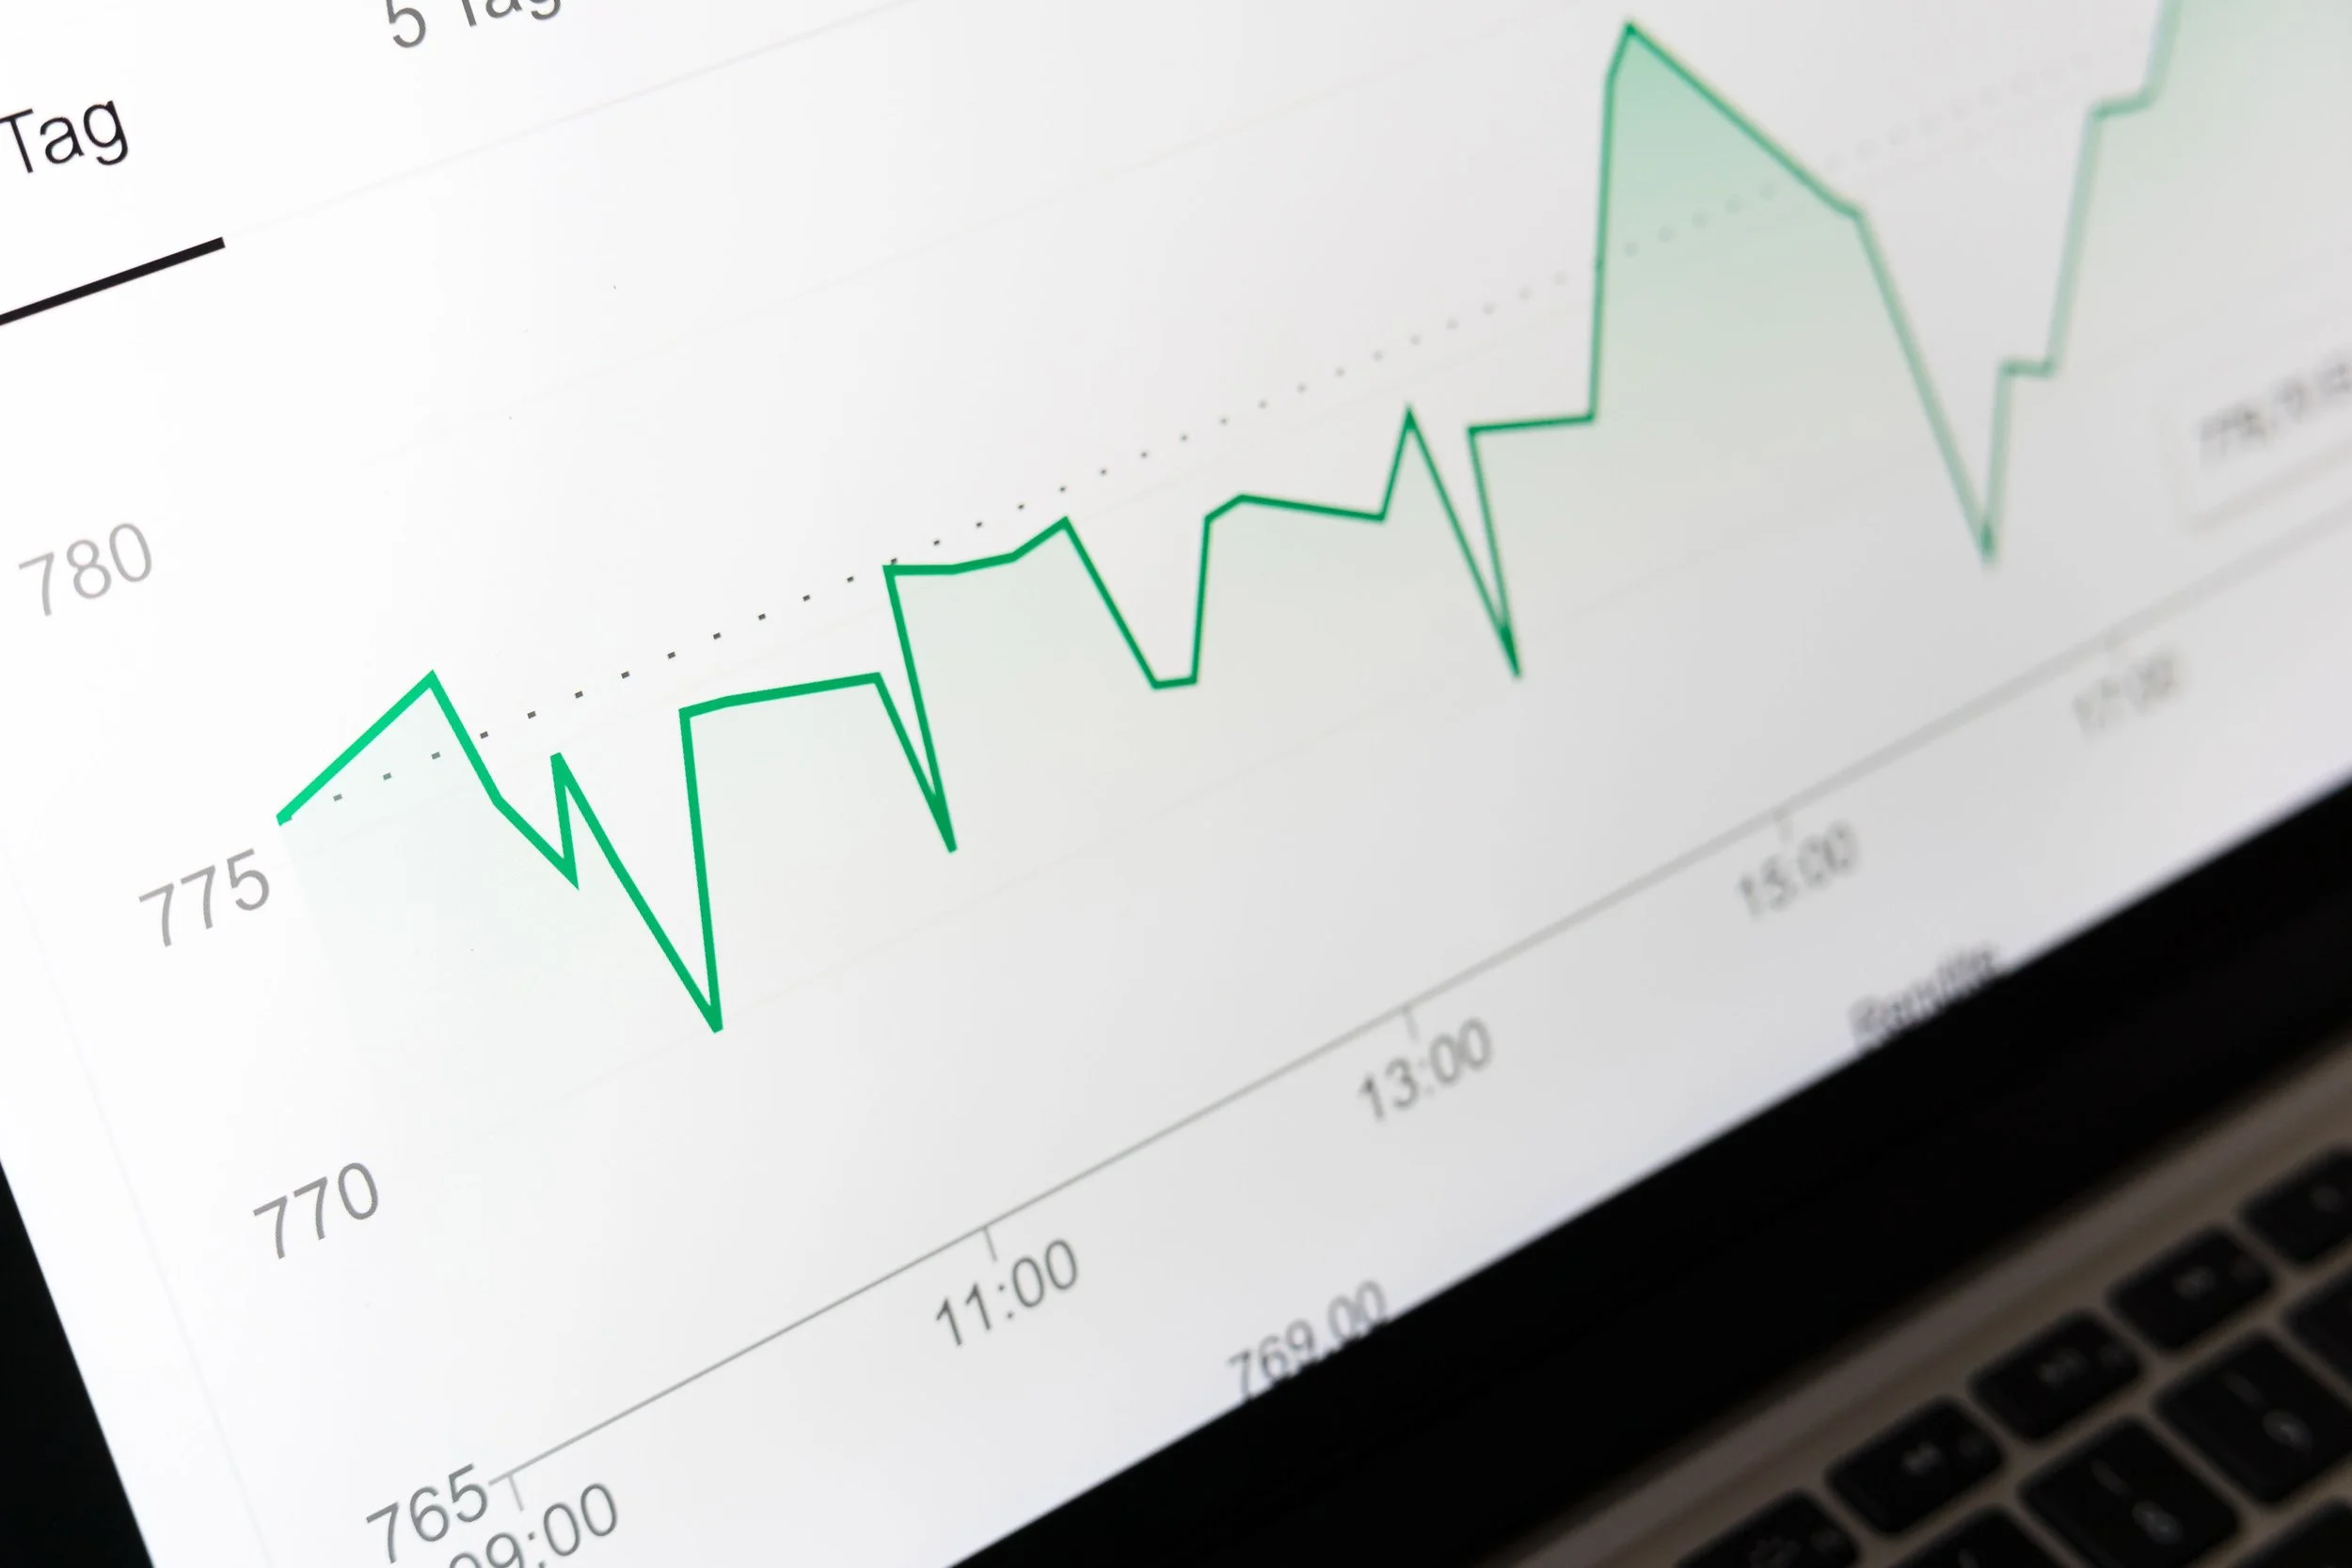
Commercial building owners usually only see energy-use through a monthly utility bill. While that information is useful, it only tells part of the story A bill might show that your building used 120,000 kWh in August, but it does not necessarily show when that energy was used throughout the month.
This is when interval energy data becomes valuable. Instead of looking at one monthly total, interval data breaks-down energy consumption into small chunks; often every 15 minutes, 30 minutes, or hour.
For building owners and operators, that additional detail can reveal patterns that are difficult to see from monthly utility bills or annual benchmarking alone.
What Is Interval Energy Data?
Interval energy data is utility consumption information recorded at regular intervals throughout the day.
Depending on the utility and meter, energy use may be recorded every:
15 minutes
30 minutes
60 minutes
For example, a traditional monthly bill may tell you that a building consumed 100,000 kWh during a billing period. With 15-minute energy data, that same month could contain nearly 3,000 individual readings.
Those readings create a much more detailed picture of commercial building energy use.
Rather than simply knowing how much energy was consumed, building owners can begin to see when consumption rises, when it falls, and whether the building's energy use matches its actual operating schedule.
Where Does Interval Meter Data Come From?
For many commercial buildings, interval meter data comes directly from the electric utility. Modern smart-meters record electricity consumption or demand throughout the day, and make that information available through a utility portal or data request.
Additional energy information may also come from:
Building automation systems
Energy management systems
Electrical submeters
Tenant submeters
Utility data platforms
The amount of detail available will depend on the building, utility, and metering infrastructure.
It is also important to remember that interval data is not the same thing as equipment-level monitoring. A whole-building electric meter can show that electricity use increased at 4:00 a.m., for example, but it may not identify exactly which piece of equipment caused the increase.
Interval data tells you where to start looking, it is not the final answer.
What Is a Building Load Profile?
When interval data is plotted over time, it creates a building load profile. A load profile shows how a building's electricity consumption or demand changes throughout the day.
For a typical office building, the profile might look something like this:
Energy use remains relatively low overnight. Consumption begins increasing before employees arrive as HVAC and lighting systems start-up for the day. Energy use stays elevated throughout occupied hours and then declines after the building closes.
That would generally make sense.
But in reality, not all buildings follow such a clean pattern.
A load profile might instead show:
HVAC systems starting several hours before occupancy
High electricity use throughout the night
Weekend consumption nearly equal to weekday consumption
Sudden demand spikes
Equipment that appears to remain operational continuously
Significant changes in operating patterns from one month to another
Those patterns can give building owners useful clues about how the property is being operated.
What Can Interval Energy Data Tell Building Owners?
One of the biggest advantages of interval data is its ability to make energy use visible over time.
1. Overnight Baseload
Every building has some amount of energy use when it is largely unoccupied.
Servers, emergency systems, refrigeration, security equipment, exterior lighting, and other loads may continue running overnight.
But unusually high overnight consumption can be worth investigating. If energy use barely decreases after occupants leave, the building may have systems or equipment operating longer than necessary.
2. HVAC Start and Stop Times
Commercial HVAC systems often begin operating before occupants arrive so the building can reach appropriate temperatures. But there is a significant difference between an HVAC system starting at 6:30 a.m. and one starting at 3:30 a.m.
Monthly utility data will not make that difference obvious. But, load profile will.
3. Weekend Energy Use
If a commercial property is closed on the weekends, its energy profile should reflect that reduced activity. If weekends look almost identical to weekdays, there may be operational reasons worth reviewing.
Understand, that does not automatically mean energy is being wasted. Some buildings have legitimate 24/7 loads or weekend occupants. The key is determining whether actual energy consumption matches how the building is supposed to operate.
4. Demand Spikes
A building may have reasonable overall energy consumption but still experience short periods of high demand that significantly affect utility costs.
Understanding when those peaks happen can help building teams determine what was operating at the time.
5. Changes in Building Operation
Interval data becomes especially useful when compared across different time periods.
Perhaps a building's morning energy use suddenly begins two hours earlier than it did six months ago. Or overnight consumption gradually increases.
Those changes may warrant a closer look at operating schedules, control sequences, occupancy patterns, or equipment.
Interval Data vs. Energy Benchmarking
Energy benchmarking and interval data answer different questions.
Benchmarking typically helps answer:
How is this building performing overall?
Metrics such as Energy Use Intensity (EUI), annual utility consumption, and ENERGY STAR scores can help owners compare performance over time or against similar properties.
Interval data asks a different question:
When is the building using energy?
A building could have an acceptable annual EUI while still operating inefficiently during certain hours.
Conversely, a building with relatively high annual consumption may have legitimate reasons for that usage, such as longer operating hours, energy-intensive tenants, or specialized equipment.
Using both forms of commercial building energy data can provide more context than relying on either one alone.
Two Buildings Can Use the Same Energy Very Differently
Consider two similar office buildings that each consume 1 million kWh per year.
On paper, their annual consumption looks identical. But their interval data could tell completely different stories.
Building A might reduce energy consumption significantly every evening and weekend. Building B might maintain a high electrical load 24 hours a day. The annual totals are the same, but the way the buildings operate is not.
This is why the shape of commercial building energy use can sometimes be just as informative as the annual total.
How Interval Data Supports Energy Audits and Retro-Commissioning
Interval data can also be useful during energy audits and retro-commissioning projects.
Before inspecting equipment, engineers can review energy patterns to understand how the building behaves over time.
For example, interval data may highlight:
Unusually high overnight loads
Early morning start times
Irregular weekend operation
Unexpected changes in demand
Seasonal operating patterns
That information can help guide further investigation.
However, interval data should not be treated as a diagnosis by itself.
If electricity consumption increases every night at midnight, the data identifies a pattern. Determining whether the cause is HVAC equipment, pumps, lighting, tenant loads, or another system requires additional investigation.
What Should Building Owners Look for First?
Owners do not need to become energy analysts to get value from interval energy data.
Start with a few basic questions:
Does energy use decrease significantly after the building closes?
Does the building start consuming more energy before occupants arrive?
Are weekends noticeably different from weekdays?
When does peak electrical demand occur?
Has the building's load profile changed over time?
Do operating patterns match the building's actual schedule?
Even a simple review can reveal questions worth investigating.
Monthly Data Shows the Total. Interval Data Shows the Pattern.
Monthly utility bills and benchmarking data are still important. They provide the big-picture view of building energy performance.
Interval energy data adds another layer.
It shows when energy is being consumed and how building operation changes throughout the day.
For commercial building owners trying to understand energy costs, improve operations, evaluate an energy audit, or investigate unexpected consumption, that additional context can be extremely useful.
